The Liveable City Index 2026: Rating Cities for the People Who Live in Them
The world's famous city rankings reward airports, museums and large companies. We built an index that asks a different question—can you actually live here?—and the league table it produces looks nothing like the tourist brochures.

Key Insights
Essential takeaways from this chronicle
Our index scores 23 cities across six lived-experience criteria—Shelter, Human Scale, Civic Voice, Nature & Climate Comfort, Everyday Mobility and Conviviality—weighted deliberately away from prestige and toward whether an ordinary resident can afford and enjoy the city.
Institute for Quality of Life / Happy City Hub. Happy City Index 2026UN-DESA. The Sustainable Development Goals Report 2025 (SDG 11)Point 1 of 4Copenhagen tops the table at 86, followed by Vienna and Trondheim at 84. The cities that dominate the famous rankings fall sharply: London drops from Resonance's global No.1 to 15th, Singapore to 13th, Los Angeles to 20th.
Point 2 of 4The UN reports that housing costs consume 21.4% of income in Europe and North America but 43.5% in Sub-Saharan Africa, and that only 19% of cities give citizens a strong voice in planning. Affordability and voice, not glamour, decide whether a city is liveable.
Point 3 of 4This is an editorial synthesis of published 2026 rankings and UN regional indicators—not primary fieldwork. Every score is a documented, whole-number judgement; data gaps are flagged rather than filled with invented numbers.
Point 4 of 4
The Liveable City Index 2026: Rating Cities for the People Who Live in Them
The world's best cities. The happiest. The most visited, the most investable, the most liveable. They come wrapped in gorgeous photography—a floodlit skyline, a market at golden hour—and they come with a number attached to each city, as if urban life were a figure-skating routine with judges holding up cards.
We read them all. And every year we notice the same quiet sleight of hand.
Open the most influential of them—Resonance Consultancy's World's Best Cities—and London sits at number one, New York second, Paris third. Look closer at what earns those places, and you find the machinery: number one for Airports. Number one for Large Companies. Top ranks for Museums, for Google Trends, for Instagram posts. These are real things. They are also, almost without exception, the metrics of a city seen from a departure lounge or a boardroom—the city as a place to fly into, invest in, photograph, and leave.
That is a legitimate way to rank a city. It is simply not the same question as: what is it like to live here?
⸻
1. The question the famous rankings don't ask
There is a second family of rankings that gets closer. The Happy City Index, produced by the Institute for Quality of Life, scores 251 cities across six well-being dimensions and crowns Copenhagen, not London. Time Out surveys tens of thousands of actual residents. These are better questions. But even they blend the resident's experience with the visitor's, and they rarely say out loud whose city they are measuring.
We wanted to ask the question plainly, and weight the answer honestly. Not which city has the best airport, but: can an ordinary person afford to live here, move through it without a car, breathe its air, find a park, be heard by its government, and feel at home on its streets?
That is the question behind the Liveable City Index. It is unapologetically a lived-experience index, and it carries a point of view—that a city which dazzles investors while pricing out its nurses is not, in any sense that matters to the nurse, a great city.
The UN's 2025 report on Sustainable Development Goal 11 gave us the vocabulary. It documents that housing costs swallow 21.4% of income in Europe and North America but 43.5% in Sub-Saharan Africa; that global urban green space fell from 19.5% in 1990 to 13.9% by 2020; that only 19% of cities—29 out of 152 studied across 50 countries—give their citizens a strong voice in how the place is planned. These are not the metrics of glamour. They are the metrics of whether a city belongs to the people in it.
⸻
2. Six criteria for a life, not a brochure
We score every city from 0 to 100 on six criteria, then combine them into a single composite with weights that deliberately tilt away from prestige and toward the fundamentals of daily life.
Shelter — weight 22%. The single heaviest criterion, because nothing else about a city matters if you cannot afford to be in it. Shelter measures housing affordability and security. This is where the famous rankings and ours diverge most violently: a city can be number one for large companies and still be a place where a teacher shares a flat with three strangers.
Human Scale — weight 20%. Can you walk? Is the city built at the height and grain of a human being—mid-rise blocks, mixed-use streets, corners a child can cross—or is it built for cars and cranes? This is UrbanStories' signature preoccupation, and it earns the second-highest weight.
Civic Voice — weight 18%. Governance, participation, equity. Do residents have a say in what happens to their streets, or is the city something done to them? The UN's finding that fewer than one in five cities offers strong participation makes this a live and underrated variable.
Nature & Climate Comfort — weight 15%. Green space, heat, resilience. As the planet warms and cities heat faster than the countryside, the presence of a tree, a river, a breathable summer is no longer a luxury.
Everyday Mobility — weight 15%. Not the number of airports, but whether you can get to work, school and a friend's flat cheaply and reliably without owning a car.
Conviviality — weight 10%. The lightest weight, and deliberately so. Culture, nightlife, third places, street life—the things the tourist rankings over-weight—matter, but they are the seasoning, not the meal. A city that scores high here and nowhere else is a great weekend and a hard life.
Each criterion is scored as a whole number. There are no decimals, because there is no honest decimal here—these are considered editorial judgements, and false precision would be its own kind of lie.
⸻
3. The table, and what fell
Here is the top of the 2026 table.
| Rank | City | Composite | Band |
|---|---|---|---|
| 1 | Copenhagen | 86 | Exemplary |
| 2 | Vienna | 84 | Exemplary |
| 3 | Trondheim | 84 | Exemplary |
| 4 | Oslo | 81 | Exemplary |
| 5 | Zurich | 78 | Strong |
| 6 | Stockholm | 78 | Strong |
| 7 | Amsterdam | 77 | Strong |
| 8 | Tokyo | 76 | Strong |
| 9 | Barcelona | 75 | Strong |
| 10 | Seoul | 72 | Strong |
And here is where the famous names landed.
London—Resonance's number one city in the world—sits at 15th on our table, with a composite of 62. Its conviviality (86) and transit reach are genuinely world-class. But a Shelter score of 38 and a Human Scale of 60 tell the story the prestige ranking hides: London is a magnificent place to visit and a brutal place to afford.
Singapore, Resonance's sixth, lands 13th. It has the highest Everyday Mobility score in the entire index (90) and elite governance and climate management. But a Shelter score of 44 reflects a city where housing performance is real and housing cost is punishing, and our lens refuses to let one hide the other.
Los Angeles, ranked 12th in the world by Resonance, falls to 20th and into the "Strained" band, at 46. A conviviality score of 81 sits atop a Human Scale of 38 and an Everyday Mobility of 42—the arithmetic signature of a car-dependent metropolis where the good life requires a good car.
Meanwhile the cities that rise are the ones the brochures find slightly boring. Trondheim—a Norwegian city of under a quarter-million that does not even appear in Resonance's global Top 100—ranks third, on the strength of a sixth-place finish in the Happy City Index and the deep affordability and civic fabric of the Nordic model. Vienna, whose social housing shelters roughly half its residents, posts the highest Shelter score in the index (87).
This inversion is not an accident or a provocation. It is what happens when you stop measuring the city as a product and start measuring it as a home.
⸻
4. Where our lens diverges—on purpose
It is worth being precise about why the table rearranges itself, because the mechanism is the argument.
The prestige rankings are, in effect, weighted toward scale and capital. Big cities have big airports, big companies, many museums, high search-engine interest. Those things correlate with global importance—and with cost, congestion and inequality. When you rank on them, you are partly ranking on bigness, and bigness is not liveability. Often it is the opposite.
Our weights invert that. By putting 22% on Shelter and 20% on Human Scale, and only 10% on Conviviality, we systematically reward cities that are affordable and walkable even if they are small and quiet, and we systematically discount cities that are famous and expensive. A mid-size Nordic city with cheap rent, good trams and a strong tenants' union will beat a global capital with a spectacular skyline and a housing emergency. That is the intended behaviour, not a bug.
The point is not that London or Los Angeles are bad cities. It is that "best city" has been quietly defined, for years, as "best city to have money in." We are defining it as "best city to live an ordinary life in," and publishing the weights so you can disagree with us precisely.
⸻
5. How the index is built—and what it is not
We owe you total honesty about the machinery, because an index that hides its methods is just an opinion wearing a lab coat.
This is an editorial synthesis, not primary fieldwork. We did not send researchers to measure rents in 23 cities. We built our scores from three published 2026 rankings and one UN report:
- Resonance's World's Best Cities 2026 gives us each city's overall standing and, where we could capture them, specific subcategory ranks (Tokyo's number-one restaurants, London's number-one airports).
- The Happy City Index 2026 gives us each city's rank and point total out of 251 cities—though, importantly, its individual dimension scores were not published, so we could not simply copy its sub-scores.
- Time Out's 2026 survey informs our sense of resident perception and conviviality.
- The UN SDG-11 2025 report supplies regional equity indicators—housing burden, green space, civic participation, service coverage—which we use as context to set an expected band for a city's region. We never treat a regional figure as a measurement of an individual city.
From those inputs, each of the six criterion scores is a documented judgement, anchored to the evidence and explained city by city in the underlying dataset. Where a city is missing from a source—Trondheim is absent from Resonance's Top 100; Los Angeles, Houston and Mexico City were not captured in the Happy City ranking we worked from—we flag the gap explicitly rather than inventing a number to fill it. You will find those flags in the dataset, next to the scores they qualify.
This matters to us more than the rankings themselves. A living-quality index is only worth reading if it refuses to fake the parts it doesn't know. Ours does.
⸻
6. A series, not a verdict
The number at the top of a city's card is the beginning of the argument, not the end of it. Over the coming weeks we will publish deep-dive reviews of the cities that best illuminate the lens: Copenhagen, the exemplar; Vienna, the housing superpower; Tokyo, the affordable megacity that the prestige rankings adore and ours quietly respects; Singapore, where performance and cost pull in opposite directions; Mumbai and Los Angeles, two very different studies in strain; and Medellín, the reform story the UN itself keeps citing.
Each review does what a number cannot: it walks the streets, weighs the trade-offs, and says honestly where our own index might be too generous or too harsh.
Because in the end, a city is not a score. It is the specific experience of a specific morning—the walk to the tram, the rent due on the first, the park you can or cannot reach, the meeting where your objection to the new road was or was not heard. The Liveable City Index is our attempt to measure that city, the one you actually live in, and to say plainly that it is the only one worth ranking.
Sources & further reading
- Resonance Consultancy. 2026 World's Best Cities Report. worldsbestcities.com — overall Top-100 ranking; three sub-indexes (Prosperity, Livability, Lovability) and 34 subcategories.
- Institute for Quality of Life & Happy City Hub Ltd. Happy City Index 2026 (6th edition). happycityindex.com — 251 cities, 64 indicators across six dimensions (Citizens, Governance, Environment, Economy, Health, Mobility).
- Time Out. The 50 Best Cities in the World in 2026. timeout.com — survey of more than 24,000 residents.
- UN Department of Economic and Social Affairs. The Sustainable Development Goals Report 2025, Goal 11 (Sustainable Cities and Communities). unstats.un.org — housing cost burden, urban green space, civic participation, waste collection and heritage-spend indicators.
- UrbanStories. Liveable City Index 2026 — full dataset and per-city methodology notes. Available with this series.
Continue Reading

The View from Below: How London Mistook Skyscrapers for Density
London spent twenty years building upward in the name of the compact city. From the pavements of Shoreditch the arithmetic looks different: the tower privatises the panorama and socialises the silhouette.
The Los Angeles That Almost Learned to Walk
In 1930, a regional parks plan and an electric rail network could have made Los Angeles a polycentric, walkable, tram-linked metropolis. The city commissioned the plan, then put it in a drawer. This is the anatomy of a choice, not a fate.
Canals Under Pressure: Amsterdam and the Living City Review
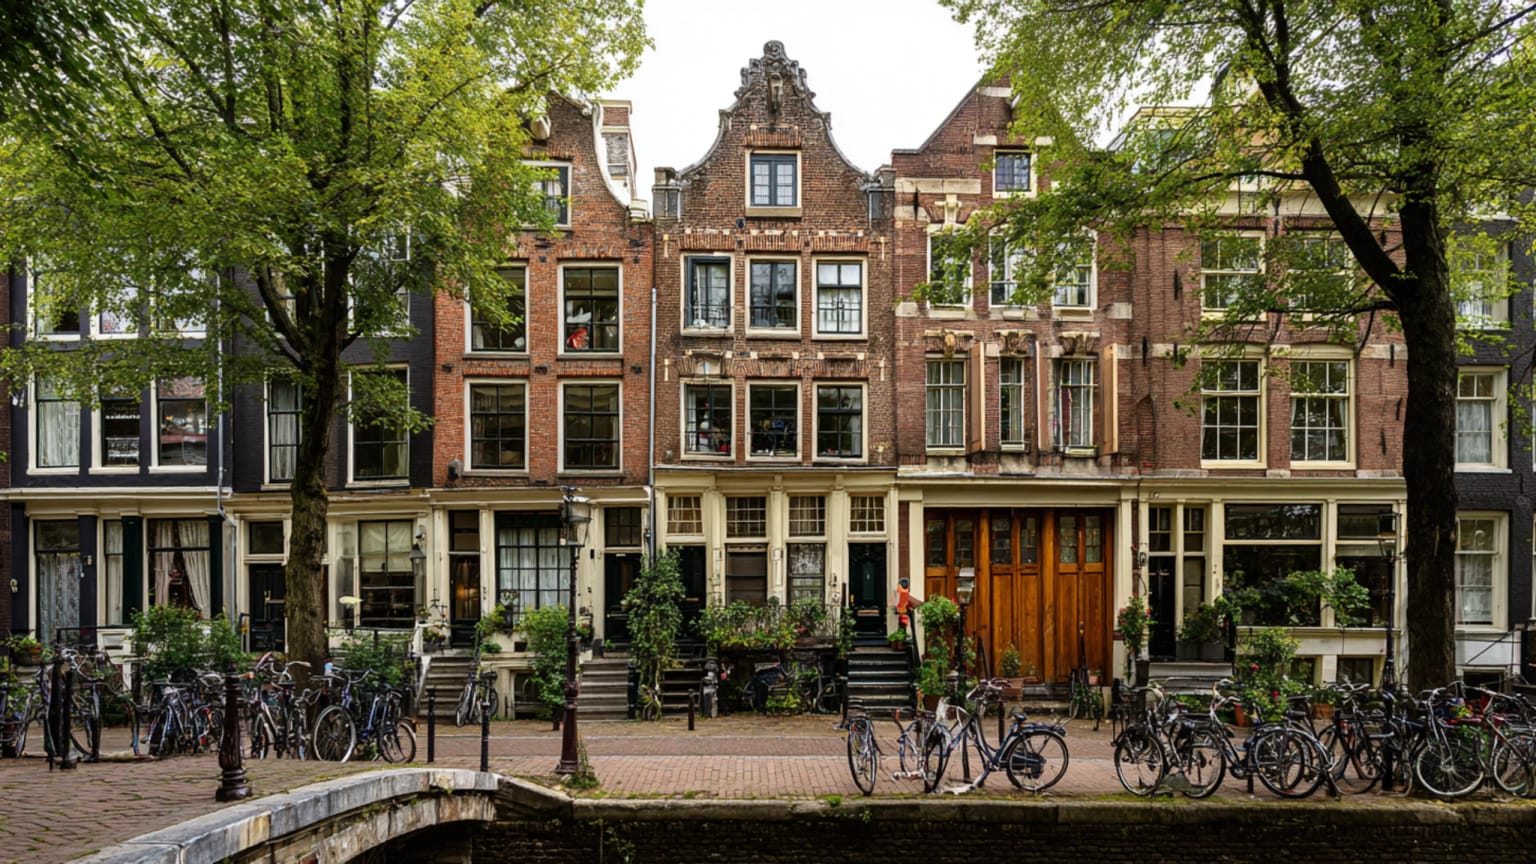
Amsterdam ranks 10th in The Living City Review 2026 with an adjusted score of 76.5. It remains one of Europe’s finest cities for daily life, but housing scarcity and tourism pressure have turned beauty into a harder civic bargain.